Having the right tool for a job can mean the difference between a task that's frustrating and completed poorly, and one that's a pleasure. For my Enginursday post this week, I'm going to revisit a theme I've explored a couple of times previously: worthwhile tools.
If you're interested in previous installments on this subject, here are a couple of my previous posts:
This time, I'm going to discuss two different tools, both of which have been getting a lot of use on my workbench. The first one is simple and inexpensive, the other is only a bit more expensive, though significantly more complex.
The Simple One
The first tool I'd like to show off today is the Metallic Silver Sharpie marker.
They're very useful when you want to write on black surfaces. In the past I'd used paint pens for that, but paint pens can be messy -- you have to pump the marker like a flux pen to get the paint to flow, and they often use toxic solvents, like toluene, to keep the paint in liquid form. The Silver Sharpie is simply a nontoxic magic marker, just uncap it and start writing.
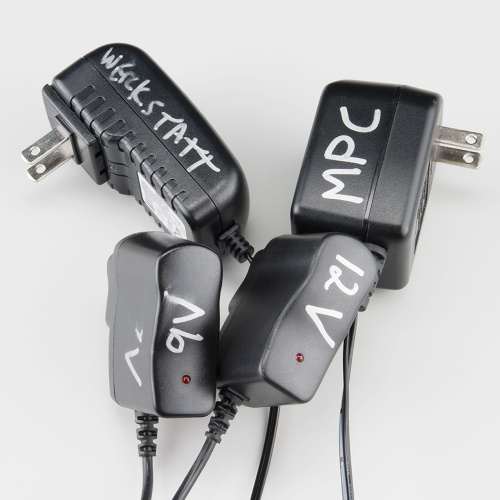
One of its most frequent uses on my workbench is to mark wall warts, so I know what voltage they produce, or what device they're intended to go with.
Silver Sharpies run a dollar or two from office or craft stores. If you store them as recommended, with the tip pointed down, they last a long time. Incidentally, the cap fits in one of the threaded holes of our third hand base to help keep it pointed tip-down.
There's also a gold version, but I wouldn't want to be ostentatious.
The Complex One
I'm going to step back to give a little historical perspective on this second tool. Understanding where it fits in the evolution of development tools makes it even more interesting.
History
The first job I took out of college was writing firmware for an embedded system based on the Motorola (now Freescale) 68000 family of microprocessors. The 68000 family was widely used - I'd previously used it when writing Palm Pilot apps in school, and it was also the heart of the Commodore Amiga and pre-PowerPC Apple MacIntoshes.
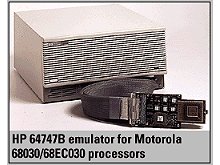
Developing for an embedded 68000 at that time involved significant investment in an In-Circuit-Emulator (ICE) system. The ICE was based around an HP Unix workstation that interfaced with the embedded platform via a module called an emulation pod. The pod plugged in to the processor socket, and controlled the system as if it were the regular processor. However, within the pod was a special version of the processor, with extra bond-wires to make the internals accessible.
This device allowed the operator to load code into the pod, then observe what was going on inside the processor as it ran. I could halt the processor, set breakpoints on particular routines, and step through machine code to see what was going on.
This device had advantages and disadvantages.
- I could see how the code was executing, but only in assembly language. The software didn't understand C, so I had to do manual translation by looking things up in the symbol table. A significant portion of the system was coded in hand-optimized assembly, so this wasn't a huge drawback, though it did mean that I needed a strong grasp on the fetch-execute architecture.
- The edit/compile/load/debug process was slow and cumbersome. The compiler ran on a different server, and I'd FTP the binary files to the emulator to debug them. If I was working quickly, I could maybe build and load four different versions in an hour.
- The emulator was extremely expensive (around $25,000, as I recall), so it was shared among a team of four or five firmware engineers. If it was busy, I simply worked on something else and came back later.
The slowness of the compile cycle, coupled with the accessibility bottleneck, meant I often had plenty of time to carefully look my code over before running it. It turned out that by inspecting the code, I often found and fixed bugs before I got access to the debugger. I also learned that I frequently tended to write the same sort of bug over & over, and that I needed to be more diligent in a couple of specific areas. In particular, I was having problems when I intermixed signed and unsigned math, especially when mixing 16 and 32-bit integers...looking at the generated instructions, and stepping at the assembly level made those errors painfully obvious!
Even with the hassles that system presented, I still get nostalgic when I'm presented with a three-tone grayscale X-11 GUI.
A Small (but significant) Step Forward
The next platform I worked on at that company was the Motorola 68332 processor. These processors effectively obsoleted the ICE by moving the debug features into the chip -- no dedicated workstation or pod required! This specific interface was known as "Background Debug Mode." It solved many of the issues of the larger system:
- It was comparatively inexpensive ($2500), so each developer could have a unit on their desk.
- It could debug C, allowing us to interact with our source files.
I don't recall that the compilation time changed much, since it moved from a Unix workstation to my local PC. Still, the other factors certainly helped the team's productivity.
From History To The Present
If you're familiar with SparkFun, you know we use the Atmel AVR family of processors in a lot of products. Most frequently, they're deployed with a serial bootloader, so they can be reprogrammed with just an FTDI cable, as you would with AVR-Dude or the Arduino IDE. While it's convenient, it leaves a lot to be desired in terms of debugging experience. To debug Arduino code, we simply pepper our sketches with Serial.print() statements, and iterate until we track down the bug...and then remember to remove all of the added diagnostics.
There is a better debugging interface on the AVR, though. It's called DebugWire. In the interest of backward compatibility, it uses serial communication over the processor reset line, which is present in the 6-pin header found on many of our AVR boards. Through DebugWire, we can load code, start & stop execution, set breakpoints, and inspect registers, and memory. An interesting piece of this debugging package is that Atmel has teamed up with Microsoft for the software environment. The free IDE is a version of Microsoft Visual Studio, which targets Atmel's AVR and SAM microcontrollers. It's a large program (and similarly a large download), but it has a lot of the debugging features discussed above.
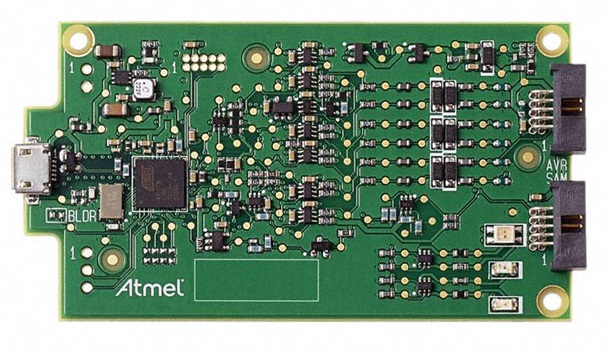
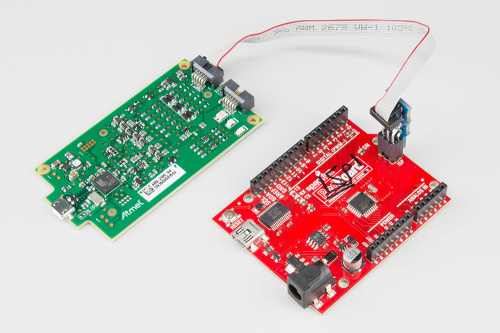
I've been using Atmel Studio for a year now, first with a JTAGICE3 module, but now with the $35 Atmel-ICE PCBA Only.
Photo courtesy Atmel
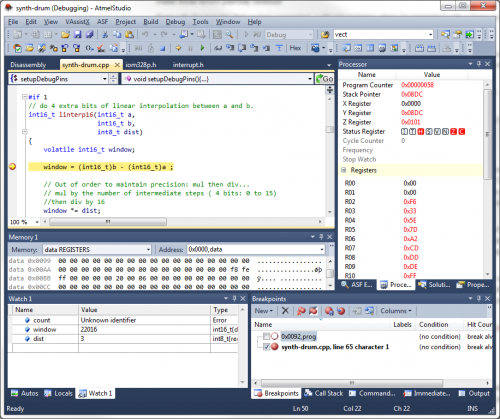
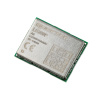
I used Atmel Studio when I developed the Servo Trigger, and it offered a number of features that helped me finish the firmware. The Servo Trigger is built around an AVR ATTiny84, which doesn't have a serial port for printing out debug messages. An interactive debugger played a critical role in getting the code right.
A breakpoint on a particularly tricky function
If you want to try programming a Servo Trigger with the AtmelICE, you'll notice that it's got the 6-pin programming header next to the processor; just plug the ICE in there, or use a PogoPin Adapter.
Next Steps
Following the Servo trigger, I've got a couple of projects that needed a larger processor. I wanted to use an ATMega328 to build a DDS waveform generator.
The RedBoard has a 328 and the ISP header, but is more commonly used with the Arduino IDE. When I plugged my ICE into it, I found that I was able to use ISP to program the processor, but I couldn't use DebugWire. A little googling turned up a blog post that explained the problem -- there's a capacitor I needed to lift to get things working.
RedBoard with C8 lifted to allow DebugWire
With DebugWire fully functional on the RedBoard, I've been able to get by DDS program working. Once again, I meet my old nemesis of intermixed signed and unsigned integer math, but I've got good tools in my corner, and know what I need to watch out for. The DDS portions are working, but there are many features I want to add. If you're curious about it, the work-in-progress, bare-metal project is in my personal Github. This is definitely a case where having the right tools available makes the job much easier.
Footnotes
If you're familiar with Arduino, but Atmel Studio seems like a big step to take, you can ease your way in with VisualMicro's Arduino IDE for Atmel Studio. It adds Arduino compatibility to Atmel Studio, so you won't be completely disoriented. I haven't had a chance to experiment with it, but Engblaze has written an installation guide for it.
This article is getting posted while I'm on vacation. I'll do my best to respond to comments below on my return.




I can definitely add my approval to the silver Sharpie!
Same here! It gets used anywhere from the kitchen to the toolbox to the hardware workstation. The only problem is keeping track of it.